
Understanding the ROI of Visualization
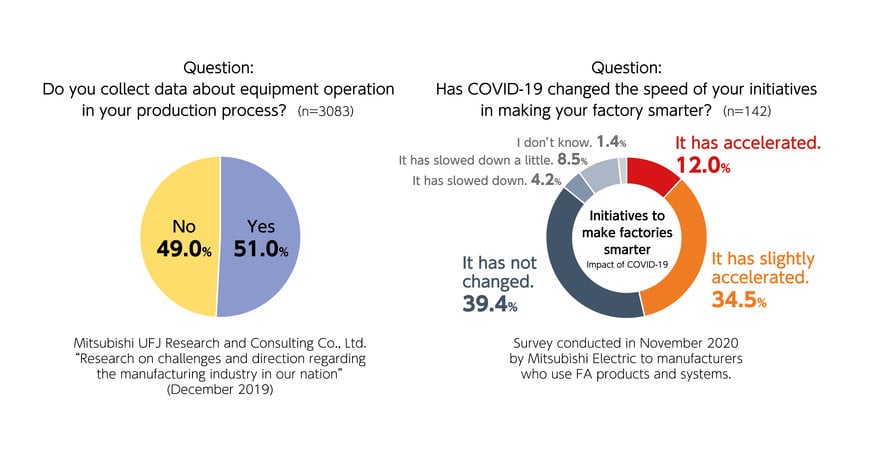
It has long been said that Internet-of-Things (IoT) should play a key role in the manufacturing industry, but according to a white paper issued in 2019 by Japan’s Ministry of Economy, Trade and Industry, the percentage of Japanese manufacturers that collected manufacturing data was just 51%. COVID-19, however, has had a major impact on manufacturing, and according to Mitsubishi Electric’s own research in 2020, 46.5% of businesses that use FA products have accelerated the evolution of their factories to become smarter. The trend towards smarter factories is closely linked to the increased need for coping with demand fluctuations and new working styles, including remote work.
In Japan, the term ‘IoT’ started to become commonly used around 2016, but long before this, in fact, as far back as 2003, Mitsubishi Electric was providing IT-OT manufacturing solutions, forerunners to IoT, to create and improve value for QCD + SE (Quality, Cost, Delivery + Safety, Environment) under the banner of its ‘e-F@ctory’ concept.
Hiroshi Nishiyuki, Head of Mitsubishi Electric’s FA System Solutions Department, explains, “e-F@ctory is our leading-edge manufacturing solution that aims to increase productivity in the entire production process from engineering and manufacturing to maintenance, with the aim of reducing the total cost of ownership (TCO). For maximum flexibility and breadth of applications, e-F@ctory is supported by more than 1,020 e-F@ctory Alliance partners around the world, all helping to create and provide digital manufacturing solutions.”
One of the priorities of e-F@ctory is to utilize data to make products more quickly, at lower cost, and reduce defects. From a management point of view, the most important aspect is the return on investment (ROI), or in other words, the payback period for your IoT investment.
“Let’s look at an example e-F@ctory solution,” Nishiyuki continued. “One of our customers wanted to achieve a high-mix production with a minimal number of line workers. They built a system where the line supervisor is immediately notified of equipment stoppages with an alert, in this case, on their wearable device. They also introduced a traceability system that utilized a commonly used BI tool. These measures helped reduce monthly equipment downtime by approximately 25%, and the payback period for this IoT investment was three years.”
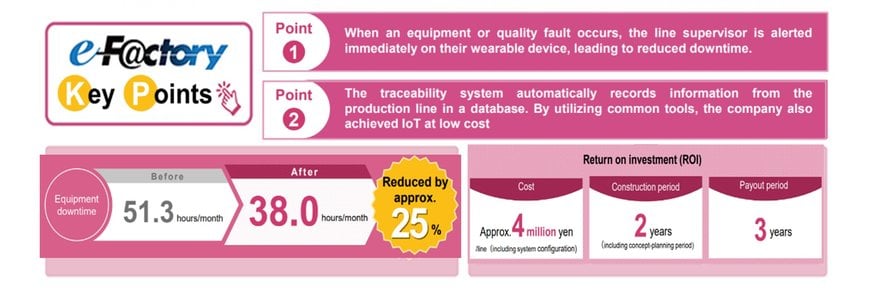
ROI example of a case where equipment downtime was reduced by 25% by using low-cost IoT
How do you decide what investments can help improve your factory?
Nishiyuki goes on to say, “At Mitsubishi Electric, we provide a target-setting tool called Smart Manufacturing Kaizen Level (SMKL) to help users easily understand their current stage in IoT deployment and set targets for additional improvement initiatives.”
By using a simple index (maturity model) that is easy to understand, decisions for investments can be agreed and implemented on a step-by-step basis, and benefit from a common understanding and agreement between management and factory operators.
In the following figure the vertical axis represents the IoT maturity level from data collection and visualization to optimization. The horizontal axis represents the management level, starting with workers and extending to the workplace, the entire factory, and then the entire supply chain.
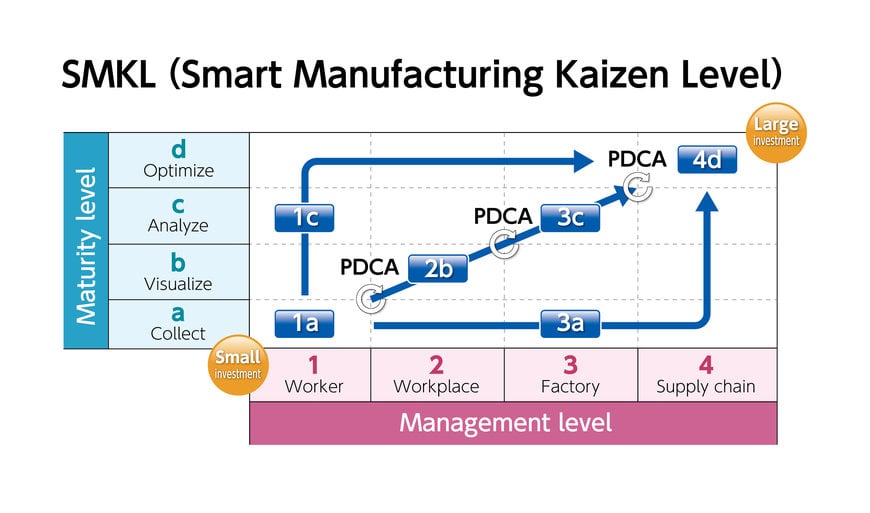
By using a simple index (maturity model), decisions for investments can be made on a step-by-step basis. It also helps create a common understanding of the actions and the reasons for those actions for all parties concerned.
To illustrate this let’s look at two cases studies, that of Iiyama Seiki and of Sunouchi, who both succeeded in introducing visualization as an effective tool to solve their issues.
Iiyama Seiki Co., Ltd.
In order to manage their precision machining costs efficiently, Iiyama Seiki visualized data from their machine tools through an ‘ANDON’ system that leveraged the edge computing platform ‘Edgecross’. In general, an ANDON system visualizes information (production status, alarms) that is collected from production equipment, sharing the information among site workers, managers and maintenance staff.
Iiyama Seiki linked the data collected by the Edgecross system with their in-house management system to visualize the operating conditions and the state of production for the various machine tools, despite using an assortment of tooling from multiple vendors. Making the information openly available allowed all relevant members to take collective action.
Sunouchi Corporation
To quickly respond to client inquiries on delivery times and to increase production capability, Sunouchi decided to digitalize their paperwork and build a one-stop system where they could see all the data from production management to sales information. Furthermore, they also fully automated the inspection processes, which were previously done manually, so that they could inspect 100% of the products they made. This added visibility was achieved by collecting data and leveraging Mitsubishi Electric’s Real Time Data Analyzer with Edgecross software.
The forefront of data visualization
Not every SCADA system has the same detailed functionality, however, in the case of GENESIS64TM its scalable architecture is a big help in delivering an integrated solution that can centrally monitor and manage OT and IT data using rich visualization functions. There are three key features to this solution.
2) Data from the production site can be uploaded to an IoT cloud service and remotely monitored via a web browser or a mobile device.
3) It utilizes an open environment such as the edge computing platform Edgecross to freely interface with other Edgecross devices and software.
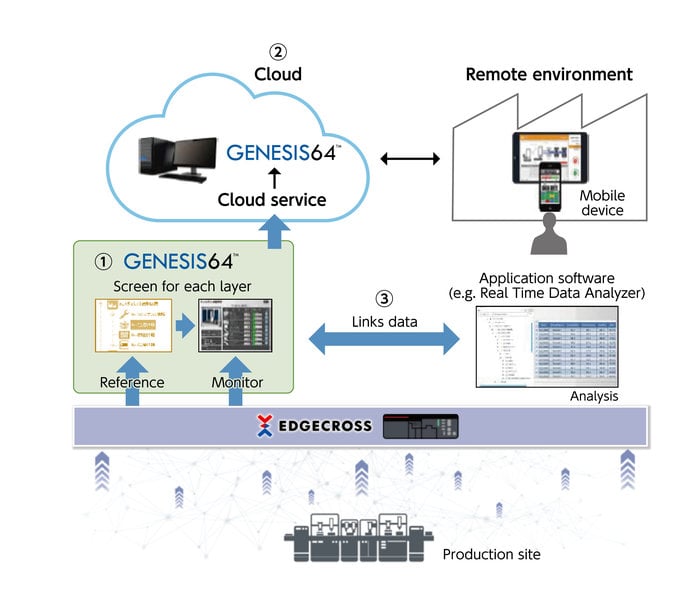
GENESIS64TM is an integrated SCADA solution that can centrally monitor and manage IT-OT data using rich visualization functions.
To try to make this example more relatable, the screenshot below depicts a sample SCADA monitoring screen that shows the operation status of a production cell manufacturing PLC units. The center of the screen displays the layout of the production line and the status of each section. The red frames indicate where an error is occurring and the yellow frames indicate the location of the workpieces, which help make it easy to understand the condition of the production line. What’s more, various KPIs can be shown, for example on the right side of the screen, to check the production progress and the current OEE.
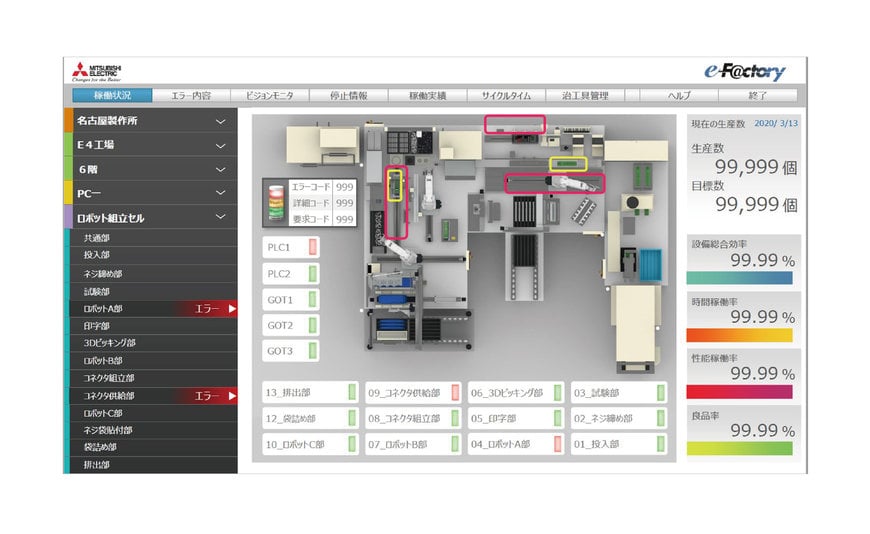
This example of a GENESIS64TM monitoring screen shows the operational status of one of Mitsubishi Electric’s PLC unit production cells
SCADA software, however, is not the only tool that can be used to visualize data. There are a variety of different options depending on the condition of the factory and the user’s needs. For example, if there is stand-alone equipment consisting of a PLC with an accompanying graphic operation terminal (GOT), it might be advantageous to leverage its data for further analytical processes. In that case Mitsubishi Electric might propose using an e-F@ctory Starter Package, which can even be used by inexperienced line engineers as it comes with free of charge sample projects. On the other hand, if a small start on a low budget is required, and the target is to monitor multiple devices which may or may not be already using Mitsubishi Electric’s GOTs, then the ‘iQ Monozukuri Process Remote Monitoring’ package might be a good choice to get started quickly. There are a variety of solutions with different technical merits, expansion possibilities and cost points, however, regardless of that if you are considering such a system taking the advice of an established system integrator can be a really big help to efficiently deploy the right level of control and monitoring. The important thing is to find the ‘visualization’ tool that best fits the situation and needs of your factory.
Nishiyuki concluded, “Here, I introduced several different ways to ‘visualize’ production lines. Since budgets so often guide the selection, having a flexible approach from data capture, local processing, light monitoring up to cloud connectivity is important for users who may wish to start small and grow as their experience grows. For whatever you decide, I advise that you set targets and estimate the potential ROI in advance by using the SMKL index. And of course, if you wish, Mitsubishi Electric can help support you in setting goals and selecting the most relevant visualization tools for your facility.”

Hiroshi Nishiyuki, Head of Mitsubishi Electric’s FA System Solutions Department, explains, “The important thing is to find the ‘visualization’ tool that best fits the situation and needs of your factory.”